For most of the last three years, American consumers have been grappling with greater financial pressure from increased prices throughout the economy.
Inflation, as measured by the Consumer Price Index (CPI), has fallen since its June 2022 peak of 9.1%, but current levels of inflation still sit above the Fed’s preferred target rate of 2%. Additionally, CPI data released in April exceeded forecasts, showing year-over-year price increases of 3.5% and month-to-month increases of 0.4%. These figures present a challenge to the Federal Reserve’s earlier indications of potential interest rate cuts in 2024.
While several economic indicators, such as wage growth and unemployment rates, exhibit resilience, public sentiment towards the economy is significantly impacted by inflation rates. As prices escalate in key expenditure categories, Americans across the nation feel a tighter squeeze on their finances. One of the spending categories where consumers have faced the greatest pressure from price increases is groceries.
Recent Trends In Food Prices
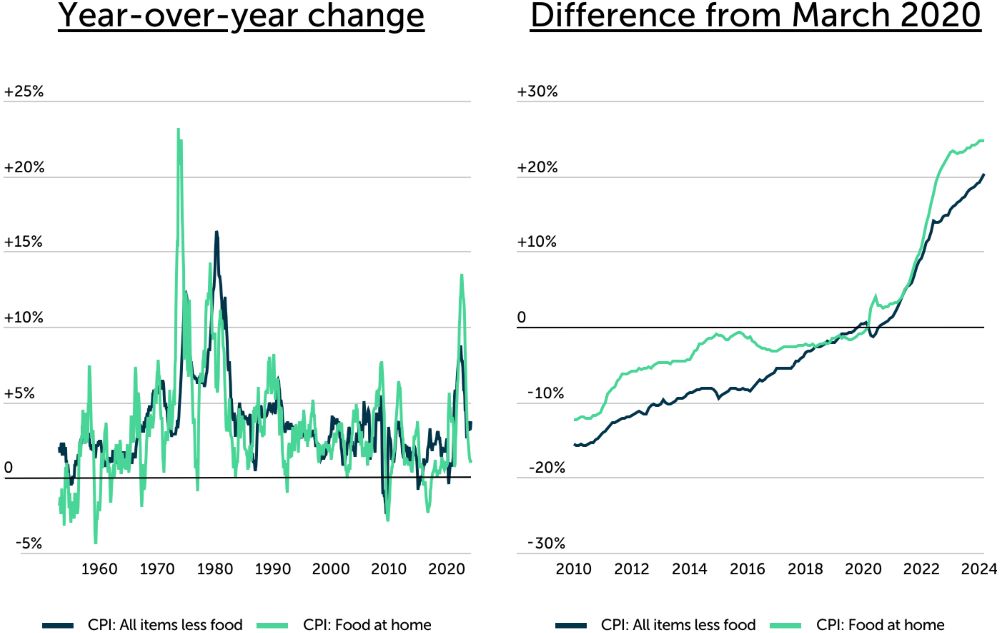
After increasing at the fastest rate since the 1970s, grocery prices remain at record highs.

Source: Trace One analysis of U.S. Bureau of Labor Statistics data.
Since the onset of the COVID-19 pandemic, food prices have surged at their fastest rate since the 1970s, rising by an astonishing 13.5% from August 2021 to August 2022 alone. While the pace of increase has moderated since then, grocery prices remain at historically high levels, adding considerable strain to household budgets. This upward trend in food costs is particularly concerning for families on tight budgets, as food expenses represent a non-negotiable necessity. Unlike discretionary spending, which can be trimmed in times of financial strain, expenditures on groceries are essential and cannot easily be reduced.
From March 2020 to March 2024, the CPI for food at home—a category that includes foods and nonalcoholic beverages meant for off premises consumption—has risen by 24.7%, outpacing the 20.3% increase observed across other CPI categories. This equates to a roughly 25% overall increase in the cost of grocery store items compared to just four years ago.
Grocery Spending By State
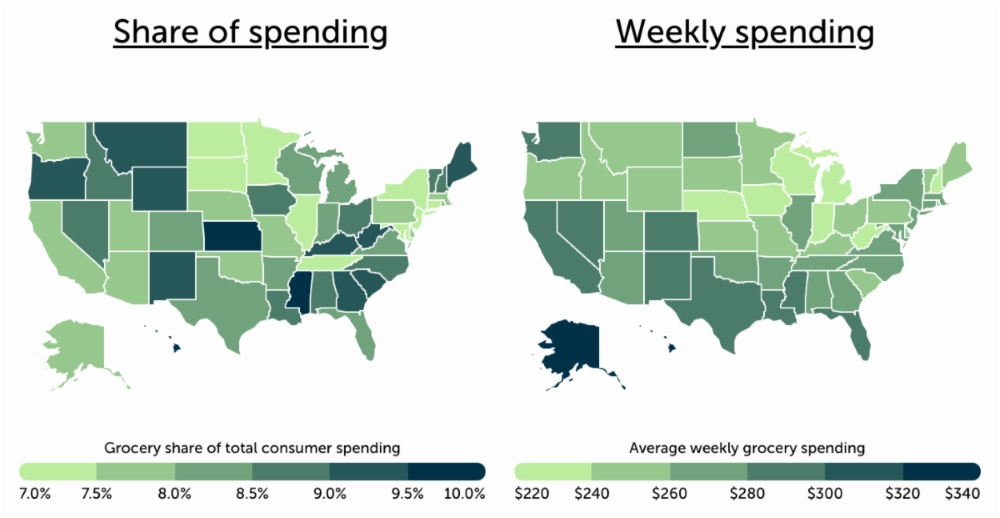
Households in Mississippi & Hawaii allocate the largest portion of total spending to groceries.

Source: Trace One analysis of U.S. Bureau of Labor Statistics data.
Food prices are one of the most heavily weighted CPI categories, reflecting the substantial portion of household budgets devoted to groceries and dining out. According to figures from the U.S. Bureau of Economic Analysis, the average American allocates approximately 8.0% of their total spending to groceries, though this percentage varies across regions. Consequently, the impact of escalating food prices is more pronounced in certain areas, exerting greater pressure on household budgets.
Groceries account for the largest share of individual spending in a number of states where income is relatively low, such as Mississippi (9.8%) and Kansas (9.5%), or where grocery prices are especially high, like Hawaii (9.7%). However, even in regions where grocery spending constitutes a smaller portion of income, consumers still find themselves grappling with significant weekly food bills. Recent data from the U.S. Census Bureau indicates that in 37 states, consumers report weekly household grocery expenditures exceeding $250 on average.
Price Changes For Common Grocery Items

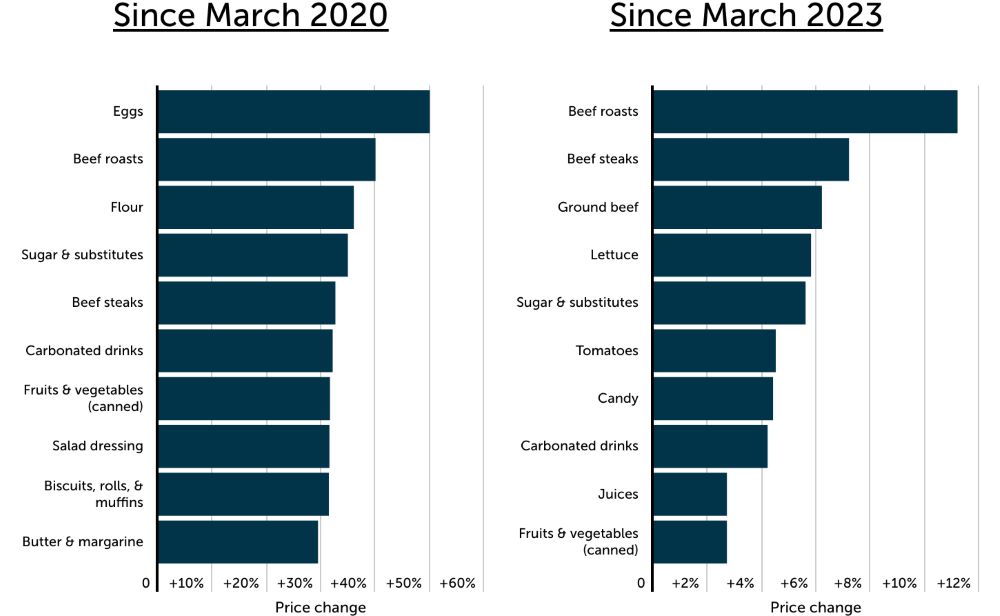
Source: Trace One analysis of U.S. Bureau of Labor Statistics data.
While grocery prices are up nearly 25% overall since the beginning of the pandemic, certain items have seen more significant upticks. Since March 2020, the cost of eggs has increased by 50%, while beef roasts, flour, and sugar have each risen by over one-third. Other items with large price increases over the same time period include carbonated beverages (up 32.1%) and canned fruits and vegetables (up +31.6%).
More recently, beef products have witnessed considerable price hikes, claiming the top three spots in year-over-year increases. Since last March, the cost of beef roasts has risen by 11.2%, steaks by 7.2%, and ground beef by 6.2%. Notably, sugar, carbonated beverages, and canned produce, which saw significant price increases since 2020, are also among the items with the largest year-over-year price hikes.
Below is a complete breakdown of price changes for nearly 40 of the most popular grocery store items, as well as grocery spending for all 50 states. The analysis was conducted by Trace One using data from the U.S. Bureau of Labor Statistics, Bureau of Economic Analysis, and Census Bureau. For more information, refer to the methodology section below.
The post Grocery Store Items That Have Increased The Most In Price first appeared in the Trace One Food & Beverage Blog, written by Trace One Senior Director of Product Management Federico Fontanella.
Methodology
Data sources include the U.S. Bureau of Labor Statistics (BLS) March 2024 Consumer Price Index, U.S. Bureau of Economic Analysis (BEA) 2022 Personal Consumption Expenditures by State (released October 2023), and U.S. Census Bureau 2023 Household Pulse Survey.
To determine the grocery store items that increased the most in price, researchers calculated the percentage change in CPI between March 2020 and March 2024 across the most common grocery (food at home) items. Researchers also calculated the two-year change in CPI between March 2022 and March 2024, as well as the one-year change in CPI between March 2023 and March 2024.
State-level data on grocery spending was sourced from the BEA and Census Bureau. The share of total consumer spending allocated to groceries for each state was calculated by dividing the per-capita spending on food and beverages purchased for off-premises consumption by the total per-capita personal consumption expenditures. Total weekly grocery spending by state and household size simply represents self-reported data collected and provided by the Household Pulse Survey.


